Free Instagram Engagement Rate Calculators Compared (2026)
Free Instagram Engagement Rate Calculators Compared (2026)
Run the same Instagram account through five free engagement rate calculators and you will get five different numbers. Sometimes the spread is wide enough to change a hiring decision.
None of them are broken. They use different formulas, different denominators, and different sample sizes, and most do not tell you which.
Here is what the main free tools actually measure, what the benchmarks say a good rate is, and the point where a free calculator stops answering the question a brand is really asking.
Why the same account returns different numbers
Three variables, and every tool picks its own combination.
The denominator. Followers, reach, or views. Followers is the only one available publicly, so most free tools use it. A tool computing on views for Reels will report a much lower number for the same post, because views routinely exceed follower count.
The numerator. Some tools count likes and comments. Others add saves and shares when they can see them. Two extra interaction types raise the result.
The sample. Social Cat's calculator analyses the six most recent posts. Others use twelve, or thirty days, or whatever you type in. A creator with one viral post in the window looks very different on a six post sample than on a thirty post one.
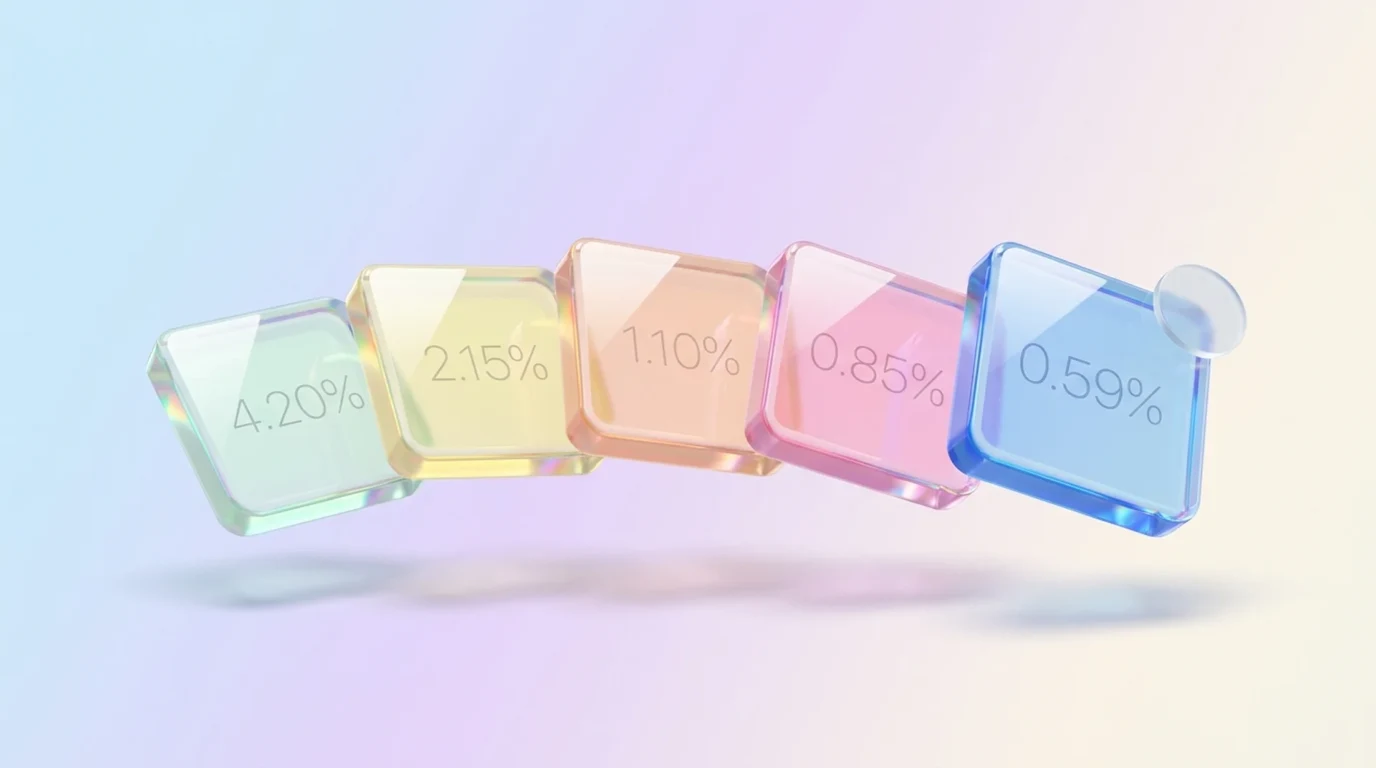
A tool reporting 4.2% and another reporting 1.1% for the same account can both be right. They answered different questions.
The tools
Phlanx
Phlanx's engagement calculator is the best known of the manual category and the one most media kits quote. It covers Instagram, Facebook, Pinterest, YouTube, TikTok and Twitter, and the company states over 40,000 people have used it.
It runs on the follower formula and gives you a clean number in seconds with no account required.
Two things to know before you trust the output. First, a manual calculator trusts whatever you type in, so averages pulled from three flattering posts produce a flattering rate and the tool cannot know. Second, reviewers consistently report that Phlanx's audience and interest signals are the weak part of the product, which matters if you were planning to use it for vetting rather than arithmetic. It holds 3.5/5 on G2 with few recent reviews, and its Trustpilot page carries a recurring complaint about trial expiry and unexpected billing rather than about the calculator itself.
Use it when you already have reliable averages and want the division done.
ProveitGo
It takes a handle and returns an audit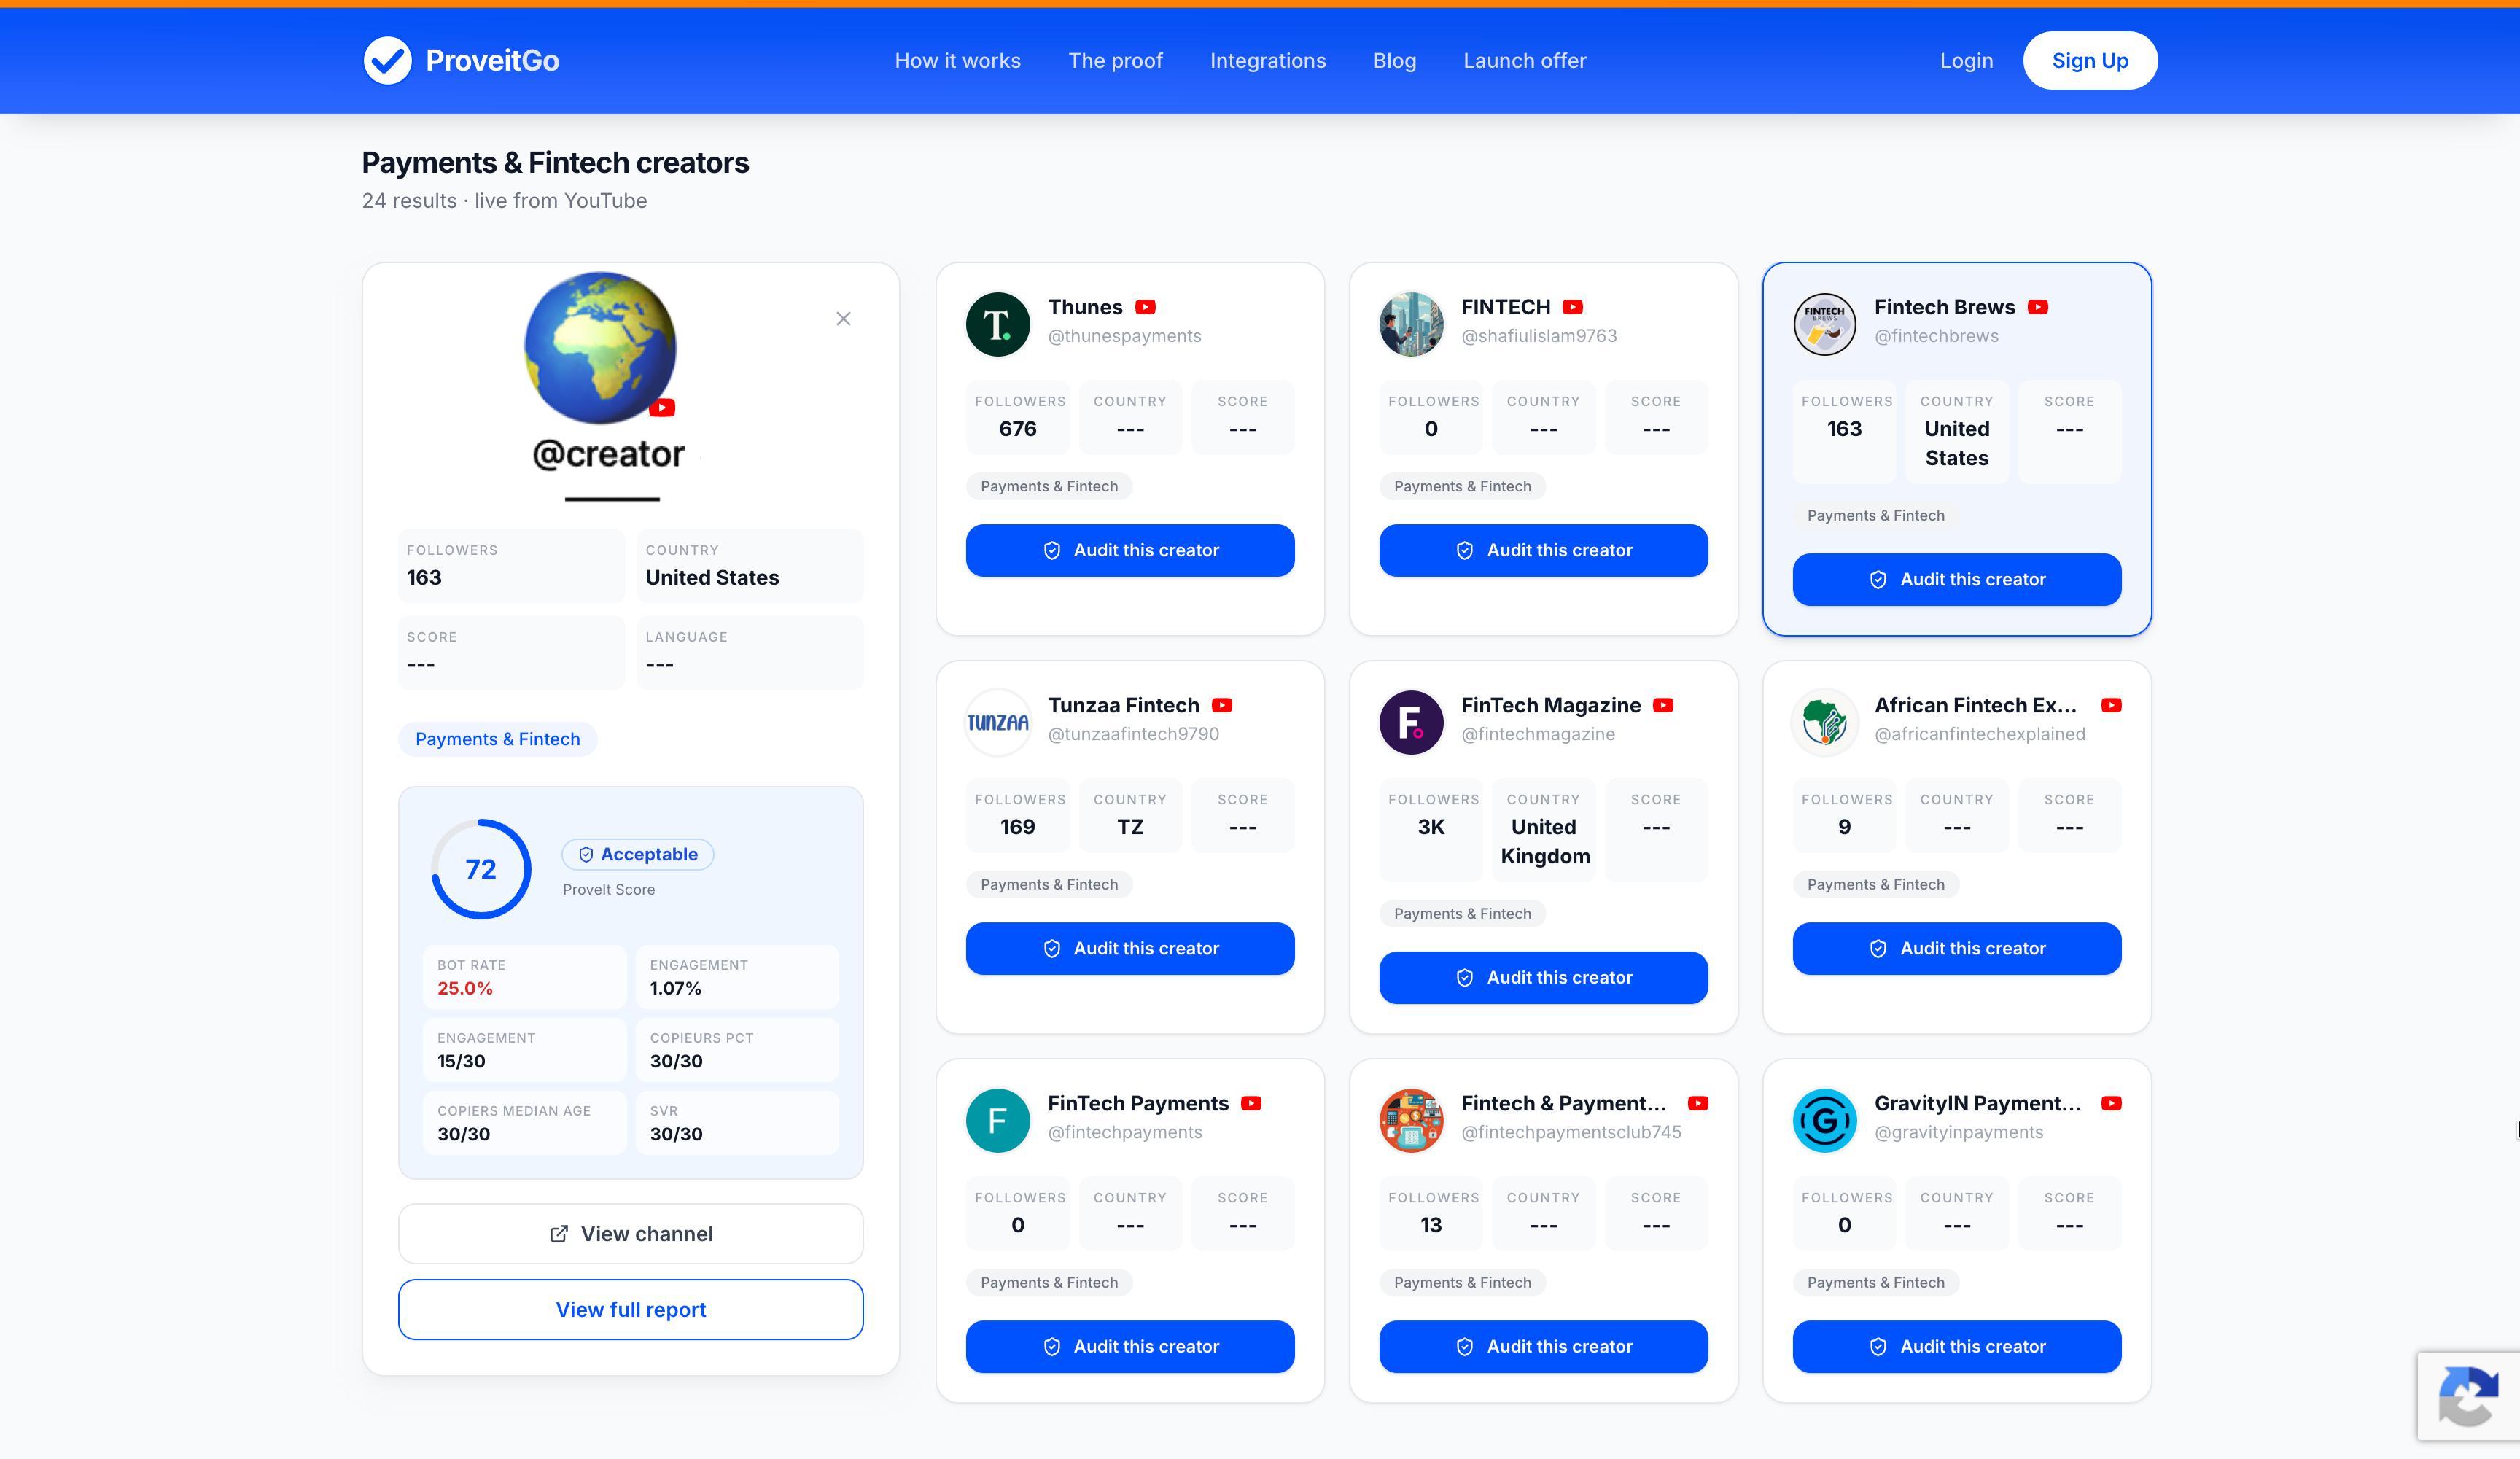 rather than a rate: engagement, but also engagement trend across recent posts, likes stability, comment depth, posting frequency, follow ratio, and an audience authenticity read, combined into a single score and a written verdict.
The reason it exists in an article about calculators is the gap described further down. Every free calculator on this page blends sponsored and organic posts into one average. Separating them is the point of the audit, because the sponsored number is the one a brand pays for.
Running an audit is free on any public Instagram or YouTube account and needs no account. The full report exports as a PDF, and that step asks for an email.
What it will not do: it audits one account at a time rather than searching a database, so it is a vetting tool, not a discovery tool. If you do not yet know who you are looking for, start with Favikon or a marketplace and come back once you have a shortlist.
Social Cat
Social Cat's calculator takes a username rather than numbers, which removes the self-reporting problem, and it discloses its sample: the six most recent posts, with an individual rate for each.
Publishing the sample size is rarer than it should be, and it is the single most useful thing a free calculator can tell you. Six posts is a small window, but a stated small window beats an unstated one.
Socialinsider
Socialinsider's tool computes engagement per post and is aimed at business accounts. Useful if you are measuring your own brand account. Less suited to vetting a creator you have no access to.
1stCollab and Collabstr
1stCollab and Collabstr both compute a rate and place it against benchmark data, which is the part most calculators skip. A number without a comparison point is hard to act on.
Both are free and both sit inside creator marketplaces, so the benchmark is drawn from the population they see.
HypeAuditor
HypeAuditor's free calculator takes a handle and returns a rate alongside a comparison against accounts of similar size, which is the tier adjustment most free tools skip.
It is the free entry point to a paid audit product, so expect the result to point you toward a fuller report. That is a fair trade for a free tool, but it means the number is presented as the start of a sales conversation rather than as a finished answer.
Favikon
Favikon sits in a different category. It is a discovery and ranking platform rather than a calculator, and engagement rate appears as one column among many.
Its Favikon Score runs 0 to 100 and blends engagement, average views, growth and recent performance, benchmarked against similar creators. A separate authority score weights audience against engagement and views. The free Chrome extension surfaces those numbers while you browse LinkedIn, Instagram, TikTok, YouTube and X, which makes it the fastest of these tools for screening a list.
Two caveats. The paid product runs on a credit system called favicoins, where each enrichment consumes credits and top-ups cost €0.10 each, so heavy vetting has a variable cost. And the platform's centre of gravity is B2B and LinkedIn creator discovery, where it is genuinely strong, rather than deep single-account Instagram vetting.
Reach for it when you do not yet know who you are looking for. It is a discovery tool, not a verification tool.
Browser extensions
Several tools, Favikon's included, overlay a rate on the profile while you browse. Fast for screening a long list, but they read what the page renders, so they inherit whatever Instagram chose to show and break when the front end changes. Treat the number as a first filter, not as evidence.
Comparison
| Tool | Input | Sample disclosed | Separates sponsored posts | Benchmark shown | Sign-up |
|---|---|---|---|---|---|
| Phlanx | You type the numbers | You choose | No | Against IG average | No |
| ProveitGo | Username | Recent posts plus history | Yes | Yes, with verdict | No, email for the PDF |
| Social Cat | Username | Yes, last 6 posts | No | Yes | No |
| Socialinsider | Username, business accounts | No | No | No | No |
| 1stCollab | Username | No | No | Yes | No |
| Collabstr | Username | No | No | Yes | No |
| HypeAuditor | Username | No | No | Yes, by account size | For full report |
| Favikon | Username or extension | No | No | Yes, ranked vs peers | For full profile |
What the benchmarks say, and which study you are reading
This is where most articles quote a number without saying who was measured. The distinction matters more than the number, because the two large published studies measure brand accounts, and the tier figures everyone repeats come from influencer platforms measuring creators. They differ by an order of magnitude.
The brand account studies
Socialinsider's 2026 benchmark report analysed 15 million Instagram posts from 417,130 pages active between October 2025 and March 2026. It puts Instagram engagement at 0.45%, down from 0.52% a year earlier, and breaks it out by format:
| Format | Engagement rate |
|---|---|
| Carousels | 0.55% |
| Reels | 0.50% |
| Single images | 0.35%, down 17% year on year |
Rival IQ's benchmark report lands lower still, at a median 0.30% per post against followers, down from 0.36%, roughly 17% year on year. Its panel is built by selecting 150 companies at random from each industry in its database.
Both are measuring company and brand pages. Both agree on the direction: engagement is falling, and by a similar amount.
The creator tier figures
The numbers you see quoted as nano at 7%, micro at 1.5% to 3.5%, macro at 0.4% to 0.9% come from influencer marketing platforms measuring creator accounts, not brand pages. They are a different population and a different behaviour, and the gap between a nano creator at 7% and a brand page at 0.30% is real rather than a measurement error.
On source quality: Socialinsider and Rival IQ both publish sample size and collection window, which puts them well above the rest of what circulates. Neither is peer-reviewed, and both are published by companies selling analytics. The creator tier figures are weaker still: most are aggregated across secondary sources and trace back to datasets that are never released.
The practical consequence: a "good engagement rate" is meaningless without two labels attached, the follower tier and whether the study measured brands or creators. A 15,000 follower creator at 1.2% is underperforming. A brand page at 1.2% is four times the Socialinsider average.
The number free calculators do not give you
Every tool above computes engagement across whatever recent posts it can see. None separate sponsored posts from organic ones.
That distinction is the one a brand is paying for. A creator can post excellent organic content and see engagement fall on anything tagged as an ad, and the ad number is what you are buying.
We measured it. We collected 161 Instagram accounts that had published a sponsored post, pulled their real follower counts, and computed engagement on the sponsored post itself.
| Engagement rate on the sponsored post | Share of accounts |
|---|---|
| 3% and above | 6% |
| 1% to 3% | 24% |
| 0.5% to 1% | 25% |
| Below 0.5% | 46% |
Median: 0.59%. Median following in the sample was 461,000, and 47 of the 161 accounts were above one million.
Where that sits is the interesting part. At 0.59%, our sponsored posts came in above the Socialinsider brand average of 0.45% and well above Rival IQ's 0.30% median, but far below the 1.5% to 3.5% the creator tier figures promise for accounts of this kind.
Sponsored content from large creators behaves closer to a brand page than to a creator page. Which makes sense: it is an ad, and audiences treat it like one.
The benchmarks are not wrong. The problem is that a free calculator hands you a blended figure across recent posts, and the sponsored subset can sit well below it without ever showing up.
On source quality: this is our own first-party measurement of 161 accounts, not a peer-reviewed study. The sample is drawn from sponsored posts that surface in public search, which over-represents larger creators. Directional, not a census.
What no calculator can tell you
Whether the engagement is real. A pod can lift a rate from 0.6% to 3% and no tool built on public counts will see it. The signal is in the comments, not the totals: the same accounts appearing under every post, replies that could sit under any post, comments running unusually high relative to likes. In our sample one account showed 21,000 likes against 22,000 comments. Arithmetic called that excellent engagement.
Whether the audience is the one you want. A 3% rate from the wrong country, age bracket or language is a 3% rate you cannot sell against.
Whether it is trending down. A snapshot cannot show direction. An account at 1.5% and falling is a different proposition from one at 1.5% and climbing.
Practical approach
Screen with a free calculator. It is fast, it is free, and it is enough to cut an obviously dead account from a shortlist.
Then, before money moves, check the three things arithmetic cannot: read twenty comments, compare a sponsored post against an organic one on the same account, and look at whether the pattern holds across the feed rather than resting on one viral post.
Those three checks take about fifteen minutes per creator by hand. For a shortlist of thirty they take an afternoon, and by the end you are skimming rather than checking. That is the part worth automating, and it is what our audit does. The division is not.
What to remember
Calculators disagree because they use different denominators, numerators and sample sizes. Always state which formula produced a figure before comparing it to anything.
Prefer a tool that discloses its sample. Social Cat states six posts. Most say nothing.
Benchmarks only mean something with a follower tier attached, and they fall steeply with size.
Across 161 sponsored posts we measured, the median engagement rate was 0.59% and 46% of accounts came in below 0.5%. That is the number a brand is buying, and no free calculator isolates it.
A calculator is a filter, not a verdict.
ProveitGo audits engagement quality, audience authenticity and growth patterns on any public Instagram account. Run a free audit.
Verify before you pay. Prove after you launch.
ProveitGo detects fake followers, bot engagement and fraud, then tracks real conversions. One dashboard, 60 seconds.
Run an Influencer Audit →