Why Every Tool Gives You a Different Engagement Rate (And Which Number to Use)
Why Every Tool Gives You a Different Engagement Rate (And Which Number to Use)
Run your account through four free engagement rate calculators and you get four answers. Sometimes they differ by a factor of ten.
Nothing is broken. They are computing different things and calling them the same word. Once you know which thing each one computes, the disagreement stops being confusing and starts being useful, because the gap between two of those numbers tells you something real about the account.
The same account, four rates
Take a TikTok account with 144 followers whose videos average 2,154 views, 122 likes and 2 comments.
| Formula | Result |
|---|---|
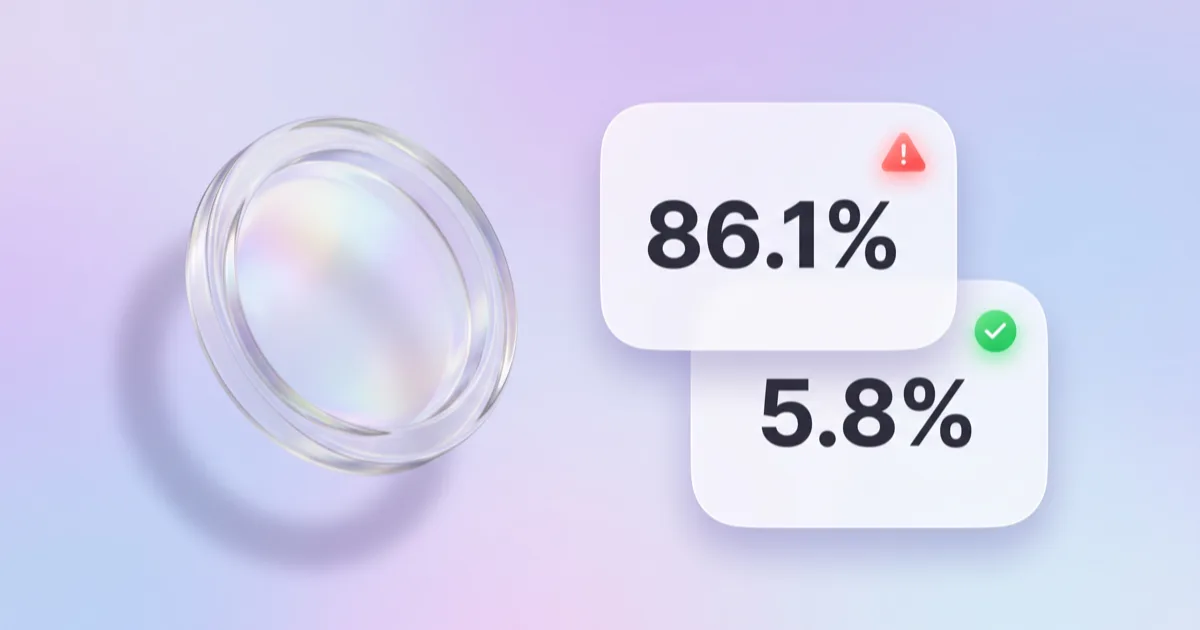
| (likes + comments) ÷ followers | 86.1% |
| (likes + comments) ÷ views | 5.8% |
| likes ÷ views | 5.7% |
| (likes + comments + shares + saves) ÷ views | higher, if the tool can see shares |
86.1% and 5.8% describe the same account on the same day. One of them is nonsense as an engagement rate, and it is the one that looks best.
Those four figures come from a real account measured by ProveitGo, which publishes the second one and not the first. The rest of this piece is the reasoning behind that choice, so you can make it yourself whatever tool you use.
The denominator is the whole argument
Engagement rate is interactions divided by an audience. The fight is over which audience.
Divided by followers answers: how much does my existing audience react? This is the classic definition, and it is the one the reference reports use. The Quid 2026 Social Media Industry Benchmark Report, published 5 March 2026 and drawn from 150 companies per industry out of a database of over 200,000, defines it exactly this way: engagement rate is "calculated by dividing total interactions by follower count."
Divided by views answers: how much did the people who actually saw this react? This is the question that matters when distribution has nothing to do with your follower count.
Neither is wrong. They answer different questions. The problem is that tools rarely say which one they answered.
Why TikTok breaks the comparison
On Instagram and YouTube, most of your reach comes from people who already follow you. Followers are a reasonable stand-in for who saw the post, so dividing by followers gives a number that means something.
On TikTok, that assumption collapses. The For You page shows videos to people who do not follow the account, so a video can reach twenty times the follower count. Dividing by followers then measures how far the algorithm pushed you, not how engaged your audience is.
That is where the 86.1% above comes from. It is not an engagement rate, it is a reach multiplier wearing an engagement rate's clothes.
And it is why cross-platform comparisons go wrong. Quid's report applies the same follower-based formula to every platform, and reports a median engagement rate of 0.30% on Instagram, 2.01% on TikTok, and 0.03% on X. Those are internally consistent, which makes them a fair league table. But TikTok's apparent advantage there is partly the denominator: follower counts on TikTok understate reach in a way they do not on Instagram.
Compare a TikTok rate to an Instagram rate only when you know both were computed the same way. Otherwise you are comparing a percentage of viewers to a percentage of followers and drawing a conclusion from the difference between two units.
What "good" looks like, per platform
With that caveat stated, the benchmarks from the Quid report are the fairest available reference, because at least one methodology was applied throughout:
| Platform | Median engagement rate (by followers) |
|---|---|
| 0.30% | |
| TikTok | 2.01% |
| X | 0.03% |
Two things follow.
Most "good engagement rate" advice online is inflated. The figure of 3% for Instagram gets repeated everywhere. Against a measured median of 0.30%, 3% is not average, it is ten times the median. If a tool tells you your Instagram engagement is 1.2% and you feel disappointed, you are comparing yourself to folklore.
Small accounts genuinely do better. This is not flattery. A few hundred followers who chose you deliberately react more than a few hundred thousand accumulated over years. A 10% rate on a 281-subscriber channel is real and worth putting in a pitch.
The gap between the two numbers is a signal
Here is the useful part, and it is why you should not simply pick one formula and forget the other.
When the followers-based rate is much higher than the views-based rate, the account is reaching well beyond its subscriber base. Healthy on TikTok, and evidence the content travels.
When the followers-based rate is high and views are low, be suspicious. Lots of likes, few views, is the shape of bought engagement or an engagement pod: interactions arriving without the reach that would normally produce them.
When both are near zero on a large account, the follower count was probably not earned. That gap is one of the things brands look at when they check for fake followers.
One number hides all of this. Two numbers make it visible.
Sample size decides whether any of it means anything
A rate computed over two videos is not a measurement. With two values, the median equals the mean, one good video moves the figure by half, and nothing about it predicts the next post.
This is the most common flaw in free calculators, and almost none of them disclose it. Some read your last 12 posts, some the last 25, some whatever a single API call returned. The number looks equally confident either way.
Before you trust an engagement rate, ask how many posts it covers. Under ten, treat it as an indication. Over twenty, treat it as a measurement. And when you publish your own rate, publish the sample size next to it. A brand that sees "5.8%, measured over 25 posts" trusts it more than a bare "5.8%", precisely because you volunteered the thing that could weaken it.
Almost no calculator does this, which is why ProveitGo prints the sample size on the kit itself and flags anything measured on fewer than five posts. The figure is still shown, because it is real and hiding it would be its own kind of dishonesty. It just arrives with the caveat attached, so the brand is not the one who has to find it.
Which number to put in your media kit
Use the views-based rate for TikTok, and the followers-based rate for Instagram and YouTube. That matches how reach actually works on each platform, and it is defensible if a brand asks.
Then label it. Two extra words settle the whole question:
TikTok    5.8% engagement (of views, 25 posts, 1 Sept 2026)
YouTube  10.7% engagement (of subscribers, 25 posts, 1 Sept 2026)
That is more convincing than a bare percentage, even a higher one. It tells a brand you know there are two formulas and that you did not pick the flattering one. See what else belongs in a media kit.
Writing those labels by hand every month is the part nobody keeps up. ProveitGo applies the per-platform rule for you, views for TikTok and followers for YouTube and Instagram, and dates each figure, so the labelling survives past the week you set it up.
Do not put the 86.1%. Someone will recompute it, and the only thing they will conclude is that you chose the number that made you look best.
Questions people ask
Which formula is correct? Both, for different questions. Correct means stating which one you used.
Why does my rate change between two tools using the same formula? Sample window, mostly. A tool reading your last 12 posts and one reading your last 25 will disagree whenever your recent posts differ from your older ones. Whether shares and saves are counted also matters, and on Instagram most tools cannot see saves at all.
Should I include shares and saves? If you can see them, yes, and say so. They are the strongest signals available: a save is worth far more than a like as evidence of intent. Just be consistent, and note it, since a rate including saves is not comparable with one that excludes them.
Is a 20% engagement rate good? On a follower-based calculation for a small TikTok account, it is probably just reach beyond your followers. On Instagram at any real size, it is a red flag, and brands read it as one. See how brands detect fake followers.
What about YouTube? YouTube publishes views on every video, so a views-based rate is easy to compute and hard to fake. The followers-based version is still the conventional one for comparison, which is why the number in a media kit needs its label.
Does the engagement rate matter more than follower count? To a brand, yes, and it has for years. Followers say how many people once clicked a button. Engagement says how many still care.
The short version
Four tools give four answers because they divide by four different things and none of them tell you which.
Divide by followers to describe your audience. Divide by views to describe your reach. Use views for TikTok, followers for Instagram and YouTube, and say which one you used and over how many posts.
The label is not a technicality. It is the difference between a number a brand accepts and a number a brand recalculates.
Both numbers, computed per platform and labelled, over your last 25 posts: ProveitGo measures them from your channels so you are not the one typing the percentage.
Verify before you pay. Prove after you launch.
ProveitGo detects fake followers, bot engagement and fraud, then tracks real conversions. One dashboard, 60 seconds.
Run an Influencer Audit →